Joel Jackson - November 28, 2020
Last year I wrote an article for strengthcoach.com on how z-scores can be used to rank the young prospects taking part in the NHL combine. I was hoping to do an updated article on this concept for the 2020 combine, but the pandemic made short work of that. Womp womp.
Combine or not, I still use Z-Scores yearly to rank athletes on each team I work with to give the coaching staff some valuable information and help them realize the benefit testing provides.
Full disclosure, I am confident in my Excel skills, but I am by no means a wiz. Adam Virgile and Dave McDowell have been pumping out Excel and Google Sheet tutorials for the last few months and they are on another level. That said, hopefully mine is easy enough to follow.
What is a Z-Score?
In the simplest terms, a z-score tells how far a certain data point is away from the average. You can calculate this score by taking a data point, subtracting it from the mean of the data set, then dividing by the standard deviation of the data set. Let's say we have a group of athletes that tested their vertical jump and the mean score for the group was 25.2 inches, with a standard deviation of 2.73. If we picked a certain athlete from this group that put up a jump height of 28 inches, their z-score would be 1.026 (28-25.2/2.73).
Now, in terms of creating an overall fitness ranking for your team, it can be quite simple if you are fine weighting each test/assessment equally. If that is the case, then you can just average how athletes rank in each test to see where individuals place overall.
For example, if we're using the beep test, long jump, grip strength, and 20 m sprint as a testing battery and a particular athlete ranked 4th in the beep test, 1st in the long jump, 7th in the grip strength, and 2nd in the 20 m sprint; their overall rank would be 3.5. However, if you want to weigh your tests differently in order to come up with an overall score, this is where the z-score can work quite nicely. If we were to use z-scores to create an overall rank with the previously mentioned tests, the beep test could count for 30% of the overall score, the long jump for 20%, the grip strength for 15%, and the 20 m sprint for 35%, making sure that your total percentage equals 100. I should also mention that even if you decide to weigh all tests the same, the use of z-scores will be a more statistically sound way to organize your data compared to using the RANK function in excel. The reason for this is that an athlete's overall z-score will give a much more precise idea of how far they deviate from the mean of the group.
A Z-Score Example: Assessments And How They're Weighted
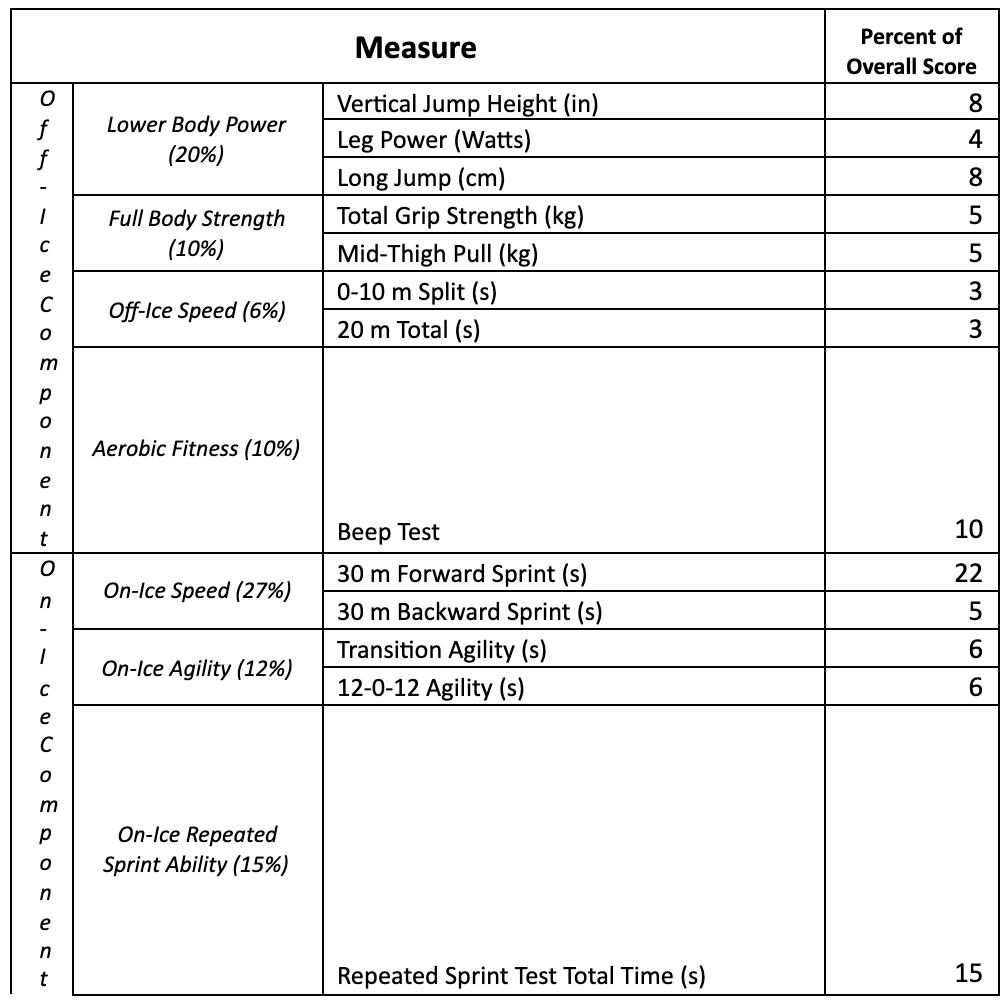
In the video tutorial portion of this article, I'm using the most recent data collected from the female hockey team that I work with here at the University of Alberta. A full breakdown of the different assessments and their percent contribution to the overall score is detailed in the table below.

What you use for testing will depend on a number of factors, including available equipment, number of athletes, space available, and other logistics. How you weigh each test may also vary depending on the situation, but should always consider what the key performance indicators are for the sport. How I have broken down the numbers above is up for debate, but I feel it paints a fairly complete picture of what a hockey player needs to possess in order to be successful.
Changing Evaluation Based on Position
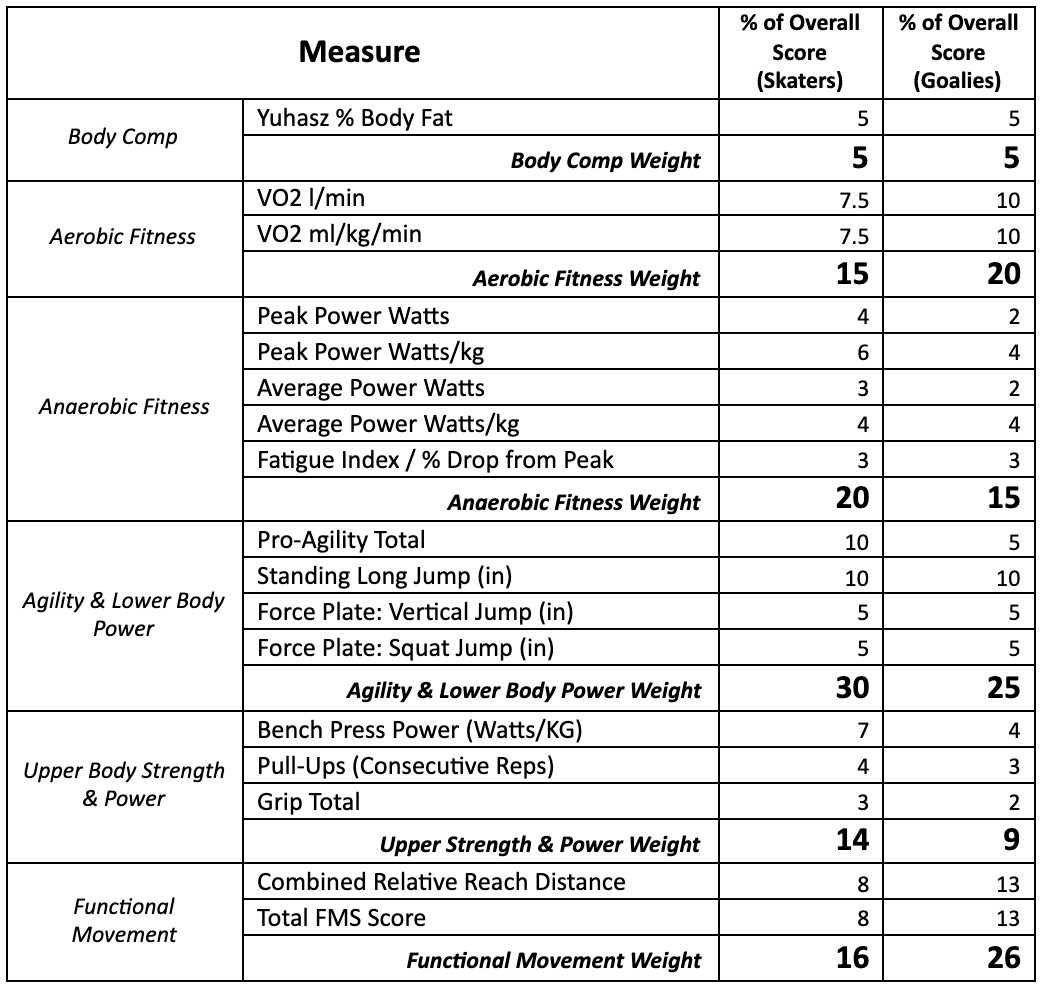
One thing that some may want to consider, is evaluating players differently based on position. Looking at the breakdown above, you may want to rate backwards skating higher for defense, but other than that I would argue that most other measures would remain similar. Conversely, goaltenders are an entirely different animal than skaters when it comes to the demands of the game. We don't do any sort of on-ice testing with our goaltenders, so they are only ranked based on their off-ice fitness testing. We've tried a number of different on-ice assessments for goaltenders, but there always seemed to be questions around their validity and reliability. It was also a bit of a logistical nightmare trying to allocate enough ice time to complete the skater and goaltender on-ice assessments. Regardless, it is interesting to consider which attributes would be weighted differently for your goalies. The table below shows how I broke down the overall score for the goalies who participated in the 2019 NHL combine and how it differs from the skaters.

|
|
|||
In the tutorial below I go through how you can take your raw data, analyze it using z-scores thus developing an overall fitness rank for your team. For those that like a visual of how the tests are conducted, I have included video links for all of the on-ice assessments that I use with my varsity teams. We use a system that allows us to set up multiple lanes and tracks all scores electronically, but all of these tests could be conducted using a basic set of Brower timing gates.
Closing Thoughts on Z-Score
From the time that I first learned how to use z-scores for this purpose during my Masters, I have found great value in the analysis. At the very least it's thought-provoking to see where your athletes fall in the rankings. There are always a few surprises. Using these z-scores is a relatively easy way to make your fitness testing/monitoring a bit more robust, without having to spend any extra cash on fancy new gear. Even if there's a small amount of equipment available to you, weighting each test so that it reflects the demands of your sport will instantly add value to the data you collect.
Z-Score Tutorial
On-Ice 30 m Forward Sprint
On-Ice 30 m Backward Sprint
On-Ice Transition Agility
On-Ice 12-0-12 Agility
On-Ice Repeated Sprint Test
Joel Jackson, M. Sc., CSCS
Joel is the strength and conditioning coach at the University of Alberta in Edmonton, Alberta and the co-founder of Competitive Thread, a company that provides on-ice speed testing technology. You can find him on Twitter (@joeljacksonsc) and Instagram (@jackson_joel)